


Industry
Infrastructure & Utilities
Challenge
The Shire of Dundas needed clearer evidence of where important freight routes and supply-chain infrastructure intersected with elevated wildfire conditions.
Results
Spatial analysis identified corridor sections exposed to elevated modelled wildfire conditions, providing an evidence base for preparedness, access review and prioritisation.
Key Product
Geoneon Wildfire
This should be priority software for infrastructure owners and freight operators led by Emergency Management Organisations at State and Federal Government levels

About
The Shire of Dundas covers a large, remote area of Western Australia’s Southern Goldfields. Freight routes through the region provide important connections between Western Australia, South Australia and remote communities.
During the 2019–20 bushfires, approximately 550,000 hectares burned across the Goldfields region and about 330 km of the Eyre Highway was closed for 12 days, demonstrating the consequences of losing access along a major freight corridor.
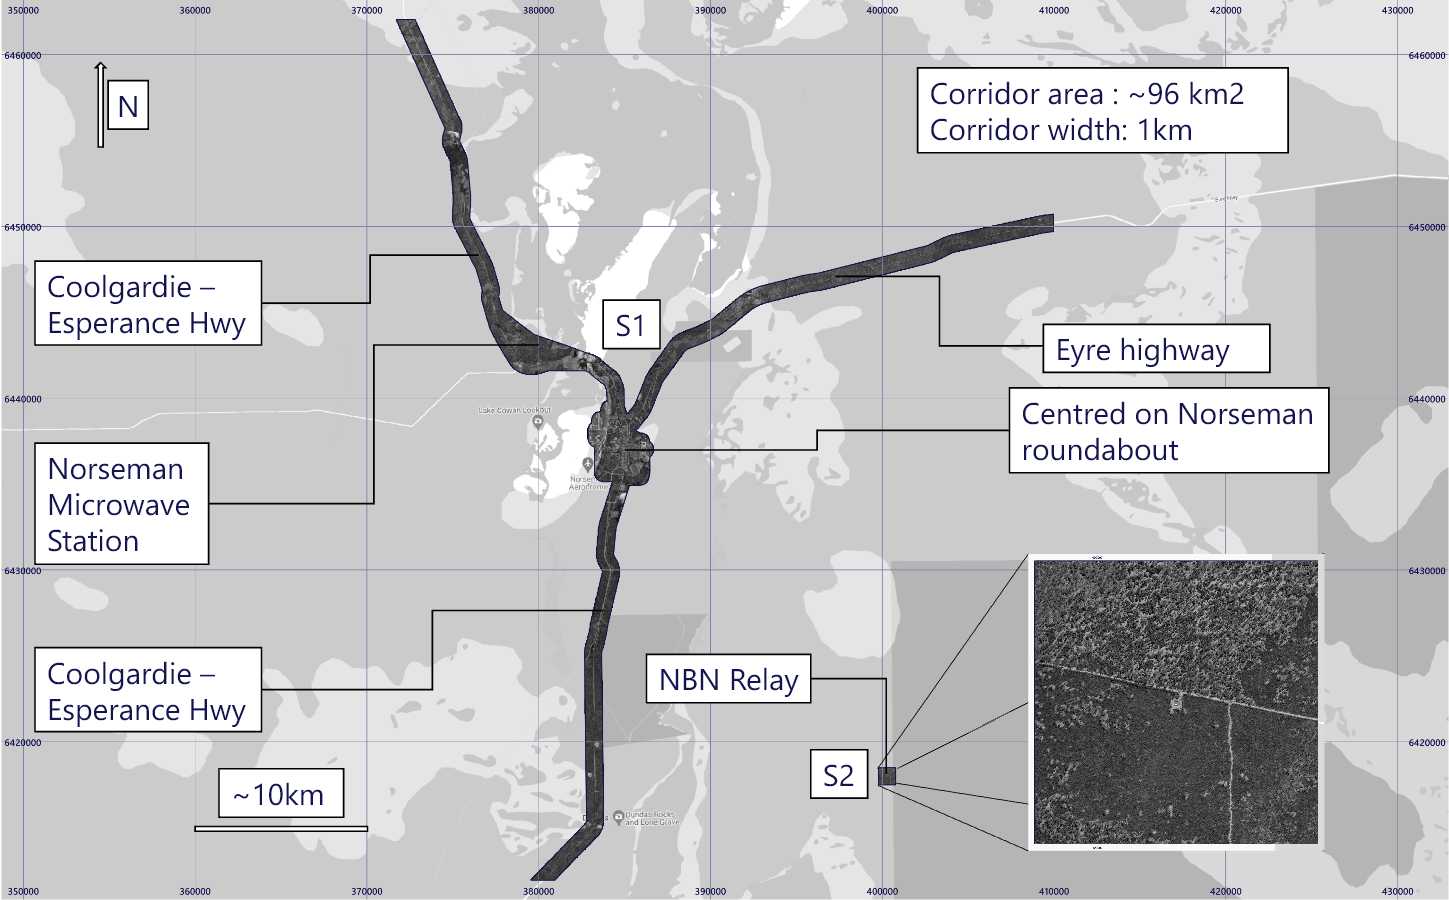
Geoneon developed a proof-of-concept analysis for the Shire of Dundas, combining wildfire conditions, infrastructure and freight information to identify relative hotspots of exposure and vulnerability along selected freight corridors.
The challenge
Existing wildfire information described conditions across the landscape, but it did not provide a clear view of how those conditions aligned with specific freight routes and supply-chain infrastructure.
The practical question was where important corridors were most exposed to elevated wildfire conditions and which locations warranted closer preparedness, access and mitigation review.
The project also needed to combine landscape information and supply-chain context in a form that could support bushfire risk-management planning and investment discussions.
What Geoneon did
As a proof of concept, Geoneon combined high-resolution earth observation, terrain, infrastructure and freight data across selected study areas.
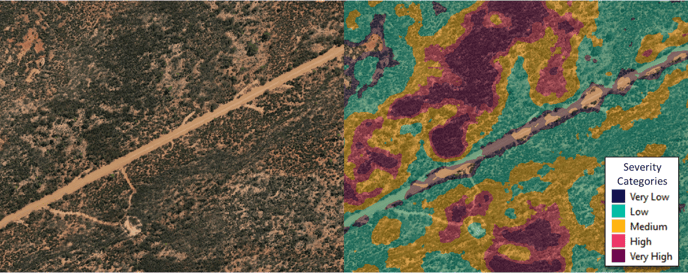
Fuel classes were derived from 50 cm, eight-band MAXAR imagery using vegetation-index thresholds and manual interpretation. Terrain information was incorporated through an approximately 30 m elevation model, and these inputs were used to calculate a relative wildfire-severity layer.
Machine learning was used specifically to identify missing building footprints. Infrastructure was represented on a 10 × 10 m grid across eight asset categories.
Geoneon then combined the modelled wildfire conditions with infrastructure values and road and rail freight information to identify relative exposure and vulnerability hotspots.
- Mapped where freight corridors and infrastructure intersected elevated modelled wildfire conditions.
- Produced infrastructure exposure and vulnerability outputs.
- Combined severity and asset-value information into a relative financial-vulnerability indicator.
- Combined severity with road and rail freight-volume information to identify relative freight-vulnerability hotspots.
Key findings
- Modelled wildfire conditions varied substantially along the assessed freight network.
- Higher relative freight vulnerability occurred where denser vegetation intersected road and rail corridors north of the Eyre Highway.
- Relative rail vulnerability was higher in some denser tree and building contexts west of Kalgoorlie.
- Sections of the Hyden–Norseman Road showed higher relative infrastructure vulnerability where vegetation was close to or overhanging the corridor.
Decision value
The outputs gave the Shire and its project partners a spatial evidence base for reviewing preparedness along important freight corridors, considering where access disruption could have greater supply-chain consequences, and prioritising locations for further investigation, vegetation management, mitigation or investment.
The analysis did not predict when a fire would occur or whether a particular route would close.
Interpretation boundary
The project was a proof of concept based on relative indicators and documented assumptions. The wildfire-severity output represents relative fuel and terrain conditions; it is not a prediction of fire occurrence or probability and does not include weather or climate.
Financial vulnerability is a weighted replacement-value indicator rather than predicted financial loss. Freight vulnerability combines modelled severity with freight volumes conditional on route disruption; it does not forecast actual disrupted freight.
Classification thresholds were calculated within individual study areas, so class values should not be compared directly between study areas. Freight data was unavailable for the Hyden–Norseman Road analysis.
Acknowledgements
Commissioned by the Shire of Dundas and delivered by Geoneon in collaboration with the Freight and Logistics Council of Western Australia, with support from the National Disaster Risk Reduction Grants Program.
Have a project or question in mind?