
Industry
Local Government
Challenge
Individual heat, canopy and demographic datasets show different parts of the urban climate challenge. Decision-makers also need a consistent way to compare those layers across places and reporting periods.
Results
A pilot across seven metropolitan Adelaide local government areas combined satellite-derived surface-temperature data, tree-canopy classification and vulnerability indicators into a repeatable framework for local comparison and adaptation planning.
Key Product
Geoneon Heat, Geoneon Vegetation
About
Geoneon delivered an Adelaide pilot in collaboration with SmartSat CRC, Green Adelaide and Flinders University, building on the SmartSat CRC Kanyini Waru research programme. The work tested how heat, canopy and vulnerability data could be brought together in a repeatable framework to support urban climate monitoring and local prioritisation.
The Challenge
Individual heat, canopy and demographic datasets show different parts of the urban climate challenge. Decision-makers also need a consistent way to compare those layers across places and reporting periods.
The Adelaide pilot examined where persistent surface heat, limited tree canopy and vulnerability indicators overlap—and how a repeatable analytical workflow could support future monitoring, reporting and adaptation planning.
What Geoneon did
Geoneon combined three linked evidence layers:
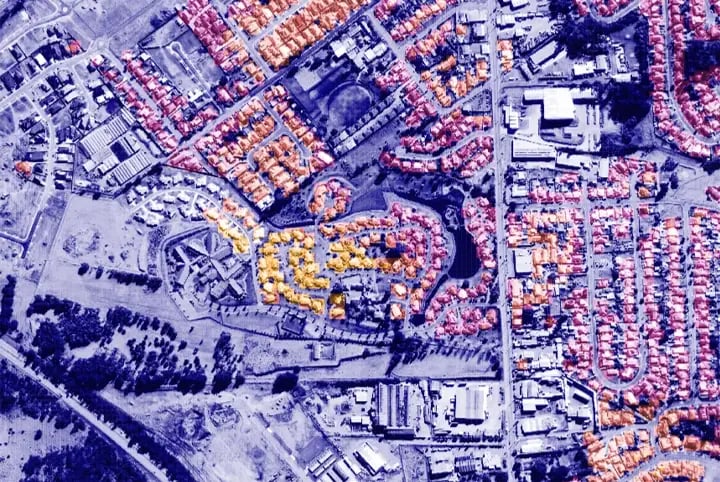
- Satellite-derived land-surface temperature from Landsat 8 and 9 imagery collected between 2020 and 2026. A Heat Susceptibility Index classified relative summer surface temperatures within the study area.
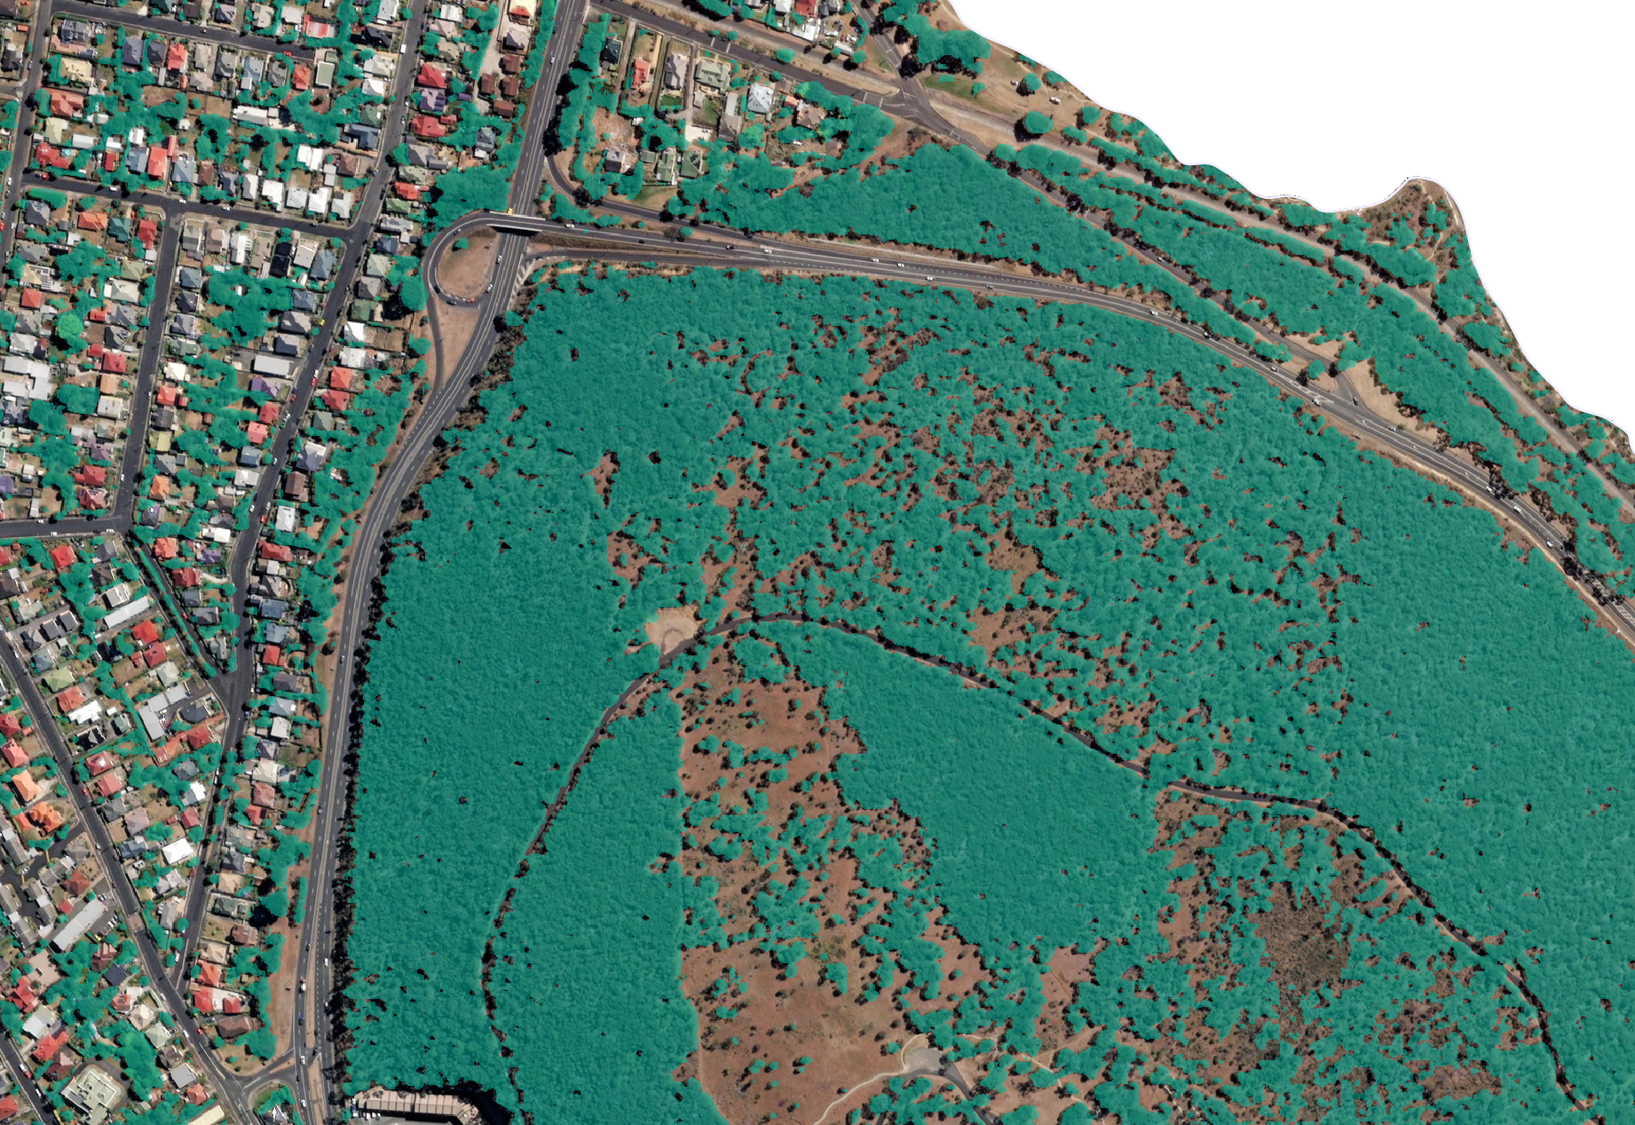
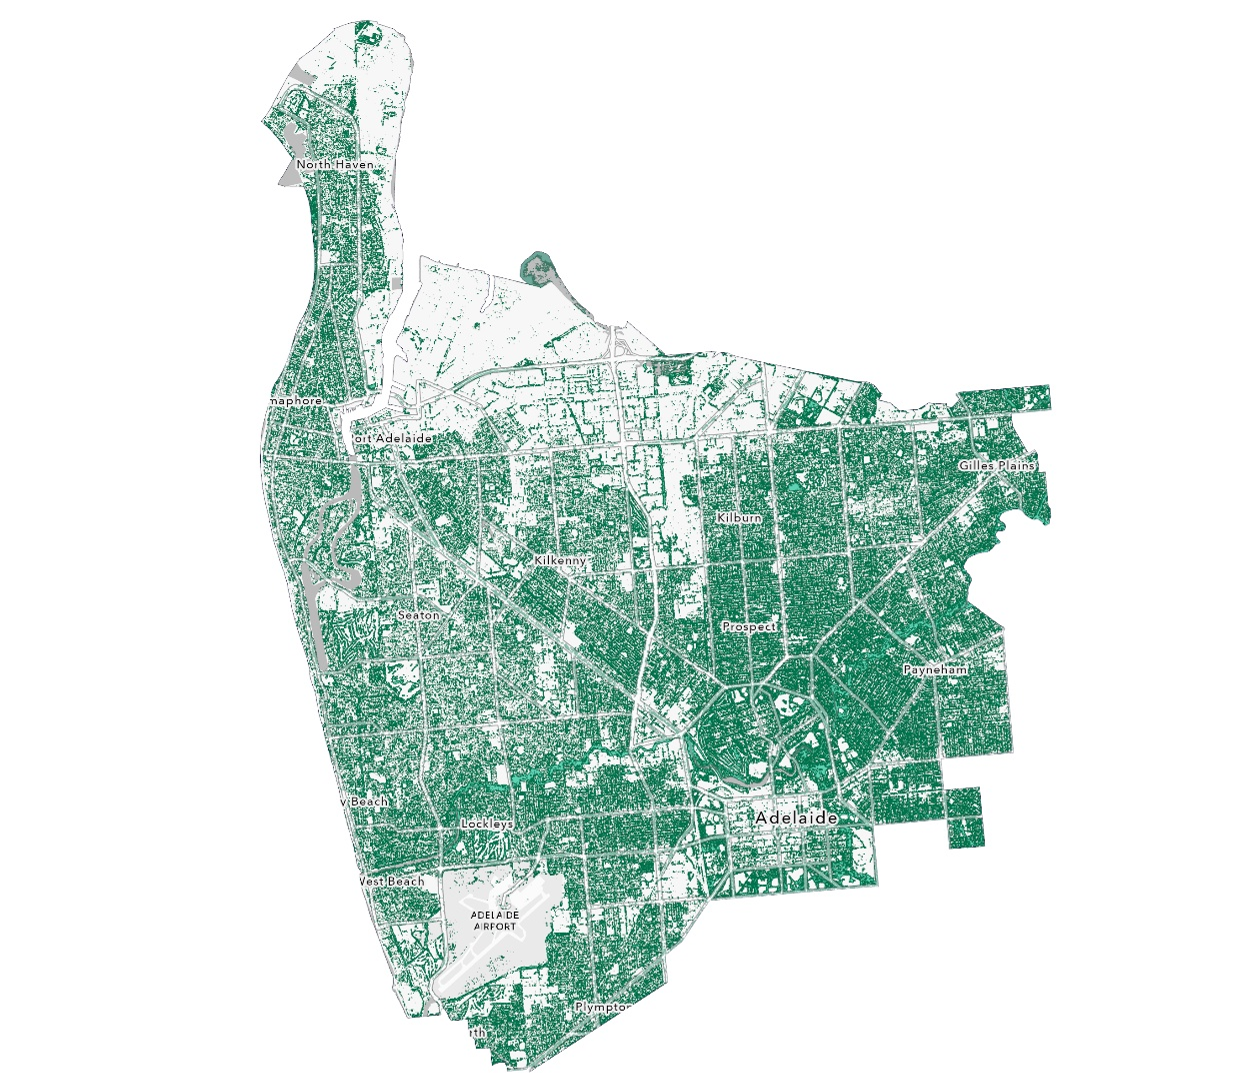
- Machine-learning classification of high-resolution aerial imagery supplied by the South Australian Department for Environment and Water, producing canopy extent, percentage and distribution layers across seven metropolitan Adelaide local government areas.
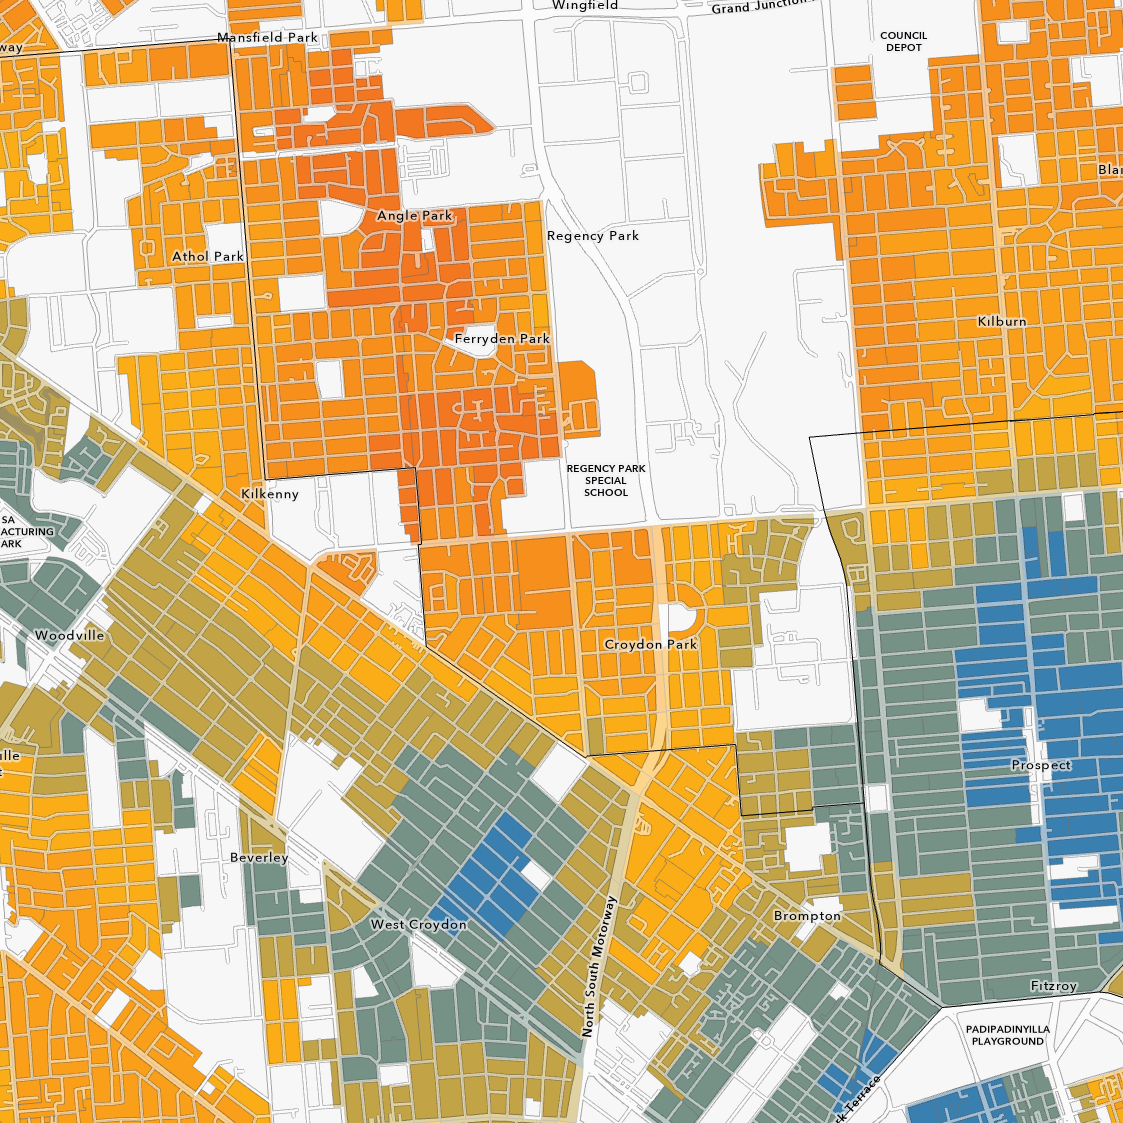
- Social vulnerability indicators derived from ABS age and socioeconomic-disadvantage data, considered alongside residential building distribution.
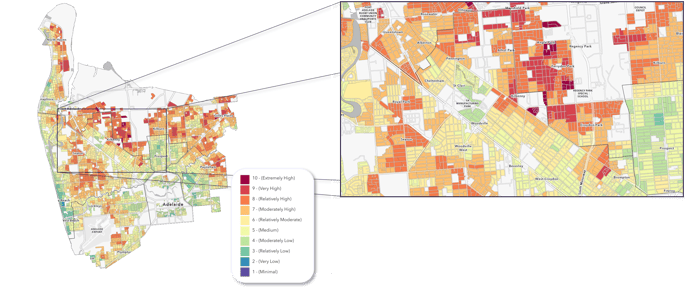
These inputs supported several related outputs, including the Heat Susceptibility Index, Residential Heat Exposure Index, Social Vulnerability Index and Residential Heat Risk Index.
Read the technical breakdown of the methodology.
Key findings
- Heat, limited canopy and vulnerability indicators varied substantially at local scales and sometimes overlapped in ways that were less visible in council-wide averages.
- In the pilot dataset, canopy cover exceeded 30% in Walkerville and was 12% in Port Adelaide Enfield.
- Nearly half of the assessed ABS Mesh Blocks had less than 15% canopy cover.
- The repeatable workflow established a basis for comparing updated datasets in future reporting periods.
Decision value
The combined outputs help identify areas that warrant closer review, compare conditions between councils and smaller statistical areas, and inform discussions about monitoring, greening and adaptation priorities.
Because the workflows can be repeated with comparable inputs, they can support future comparison and reporting. The pilot did not itself demonstrate that a particular intervention caused a measured outcome.
Interpretation boundary
The outputs are relative monitoring and prioritisation indicators, not predictions of individual health outcomes. Satellite-derived land-surface temperature is not the same as air temperature, and composite classes depend on the selected inputs, period, spatial resolution and weighting. Results should be considered with current local data and local expertise before site-level decisions.
Acknowledgements
This Adelaide pilot was delivered by Geoneon in collaboration with SmartSat CRC, Green Adelaide and Flinders University, building on the SmartSat CRC Kanyini Waru research programme. The canopy analysis used aerial imagery supplied by the South Australian Department for Environment and Water.
Have a project or question in mind?