
Industry
International Development
Challenge
Bhutan needed a consistent regional view of where buildings, roads and power infrastructure intersected with flood and slope-instability susceptibility.
Results
Across approximately 400 km², mapped infrastructure, susceptibility classes and replacement-value estimates were combined into value-weighted screening layers for closer investigation and planning.
Key Product
Custom Climate Risk Analysis
About
Across approximately 400 km² of the Phuentsholing–Pasakha and Gelephu study areas, Geoneon and Terranum delivered a pilot through the Asian Disaster Preparedness Center’s Climate Innovation Challenge.
The work mapped buildings, roads and power infrastructure, modelled several natural-hazard susceptibility processes and produced value-weighted spatial indicators to help Bhutan’s Department of Disaster Management identify areas for closer review and planning.
The challenge
Bhutan’s Department of Disaster Management needed a more consistent regional view of where buildings, roads and power infrastructure intersected with flood and slope-instability susceptibility.
Available infrastructure data were incomplete and did not provide a common basis for comparing assets across different hazard processes. The pilot therefore needed to improve infrastructure mapping while establishing a repeatable method for identifying locations where more detailed investigation could be prioritised.
What Geoneon did
Geoneon used 30–50 cm, eight-band satellite imagery and a convolutional neural network to map buildings across the two study areas. This identified 4,063 buildings around Phuentsholing and 4,713 around Gelephu.
Road and track data from government sources and OpenStreetMap were reviewed and supplemented through manual digitisation. Power-transmission and distribution assets were incorporated from government datasets.
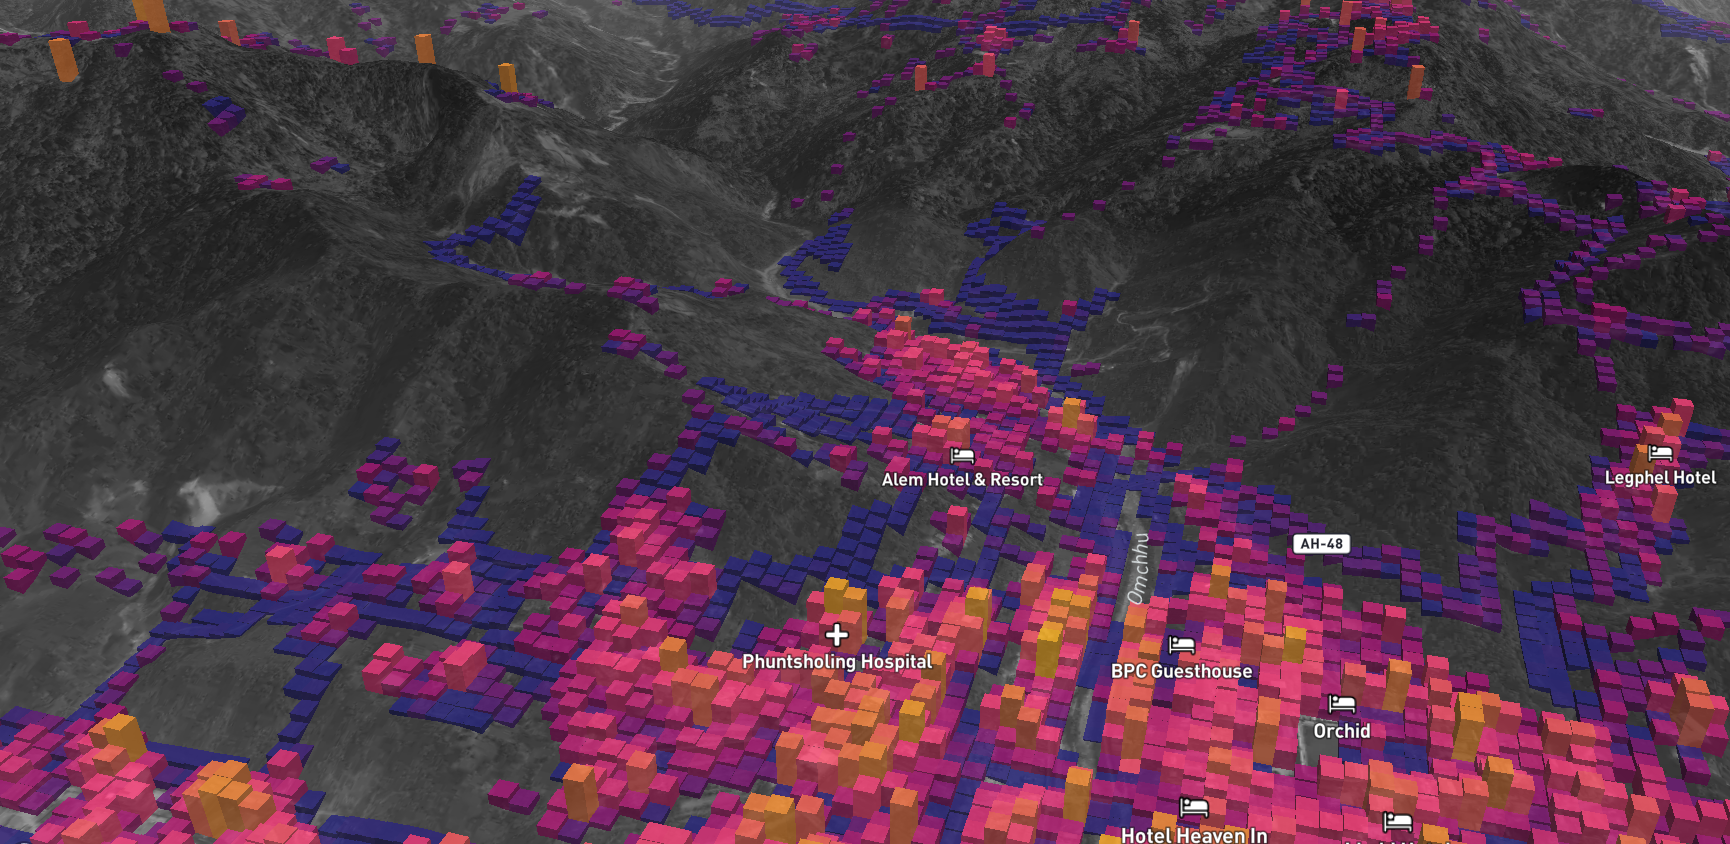
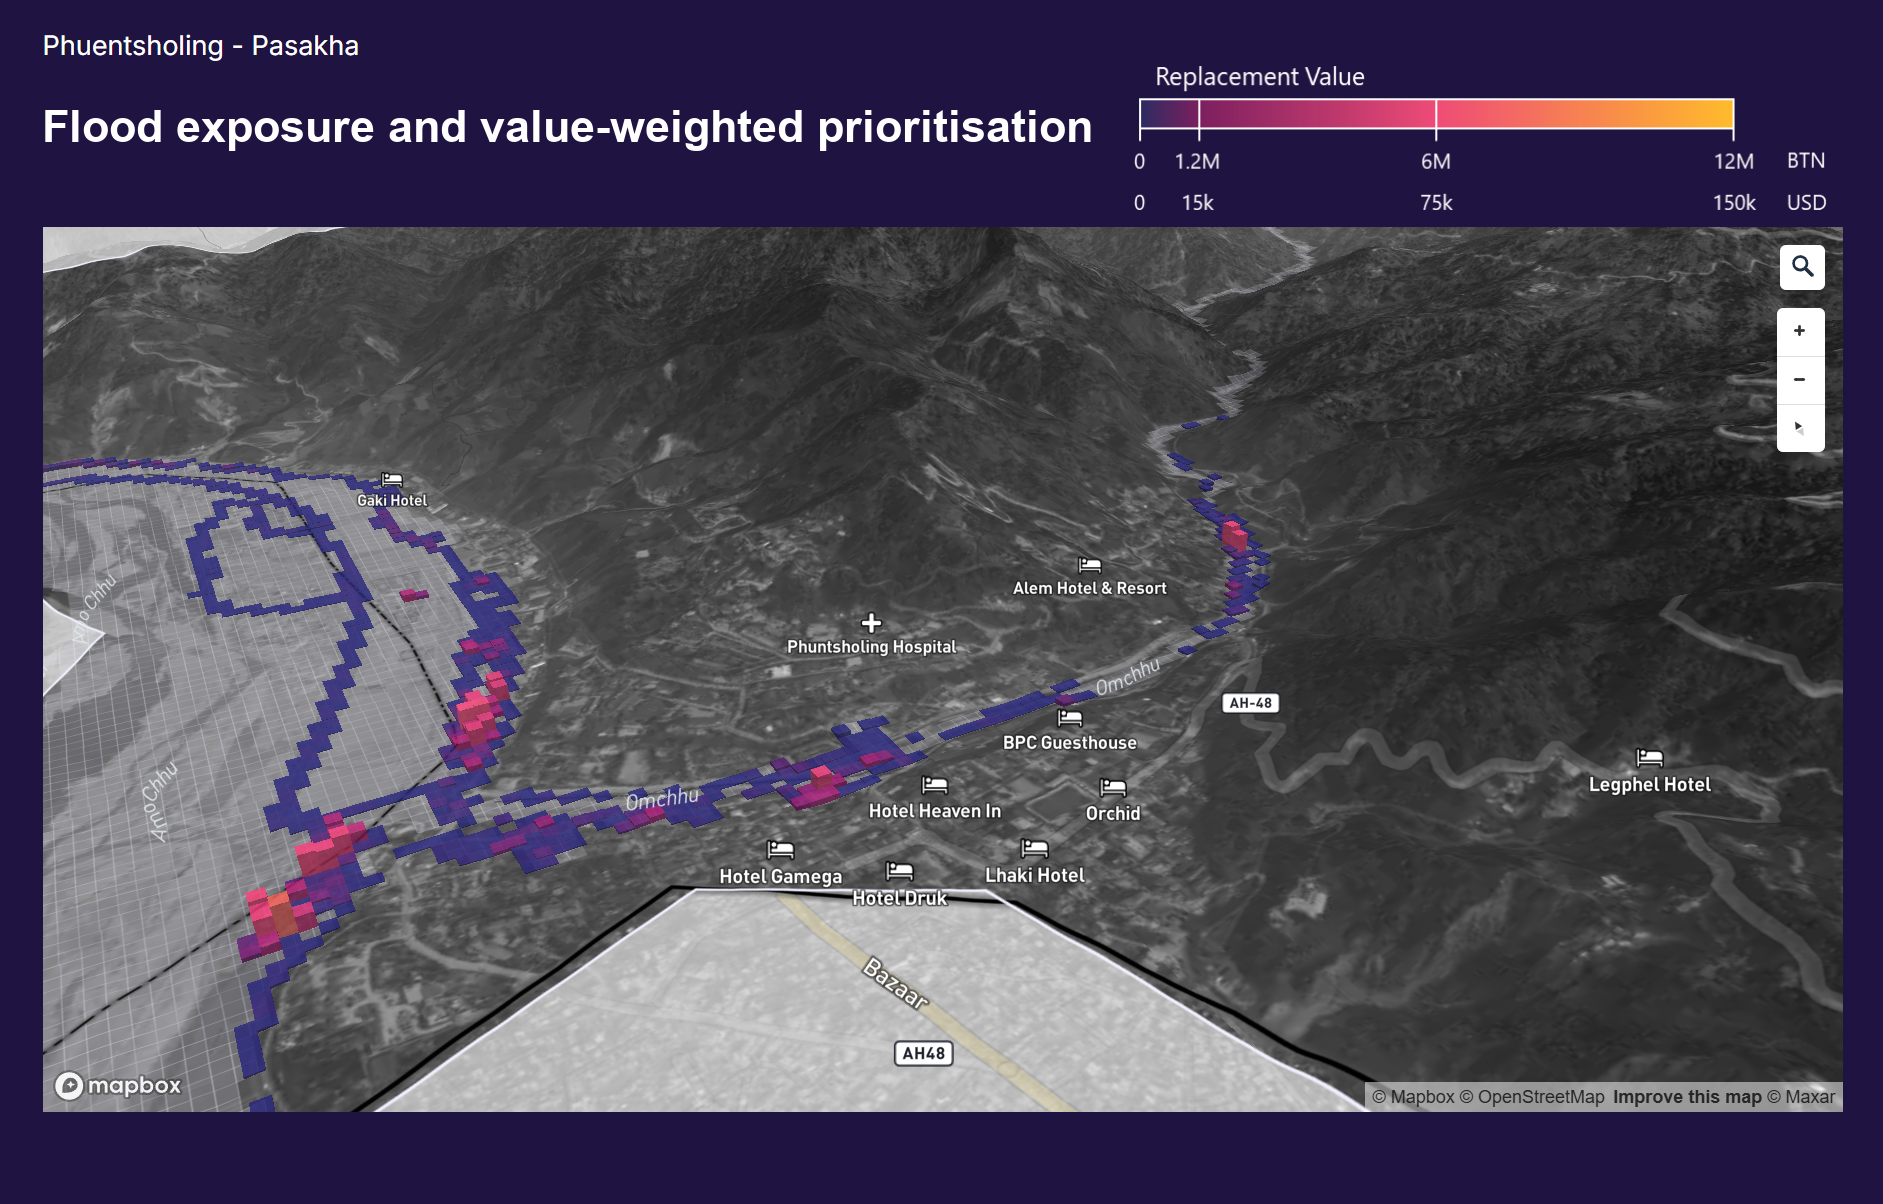
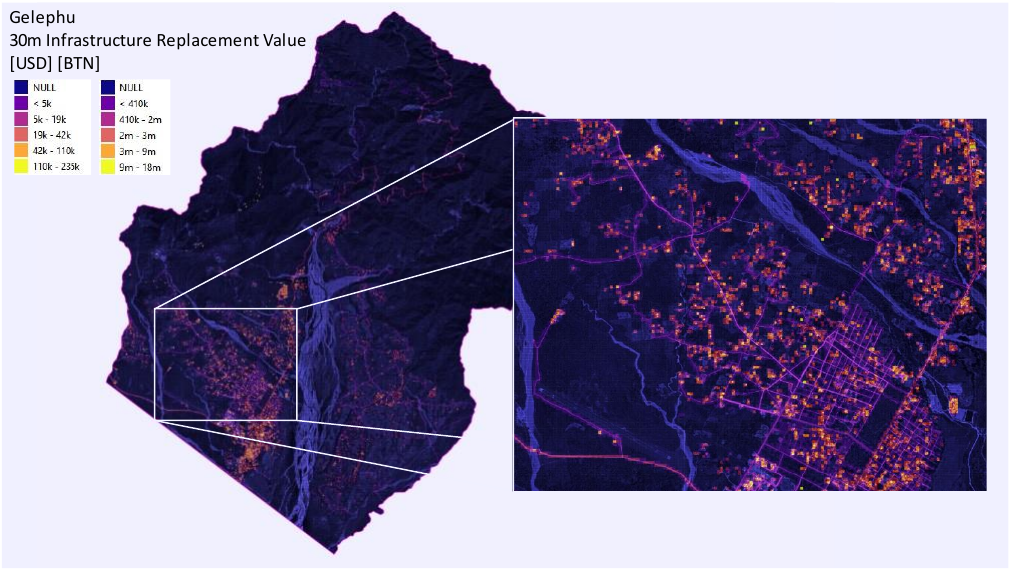
Replacement-value estimates reviewed by the Department of Disaster Management were assigned to buildings, roads and power infrastructure. These values were aggregated into 30 × 30 m grid cells to create a consistent infrastructure-value model.
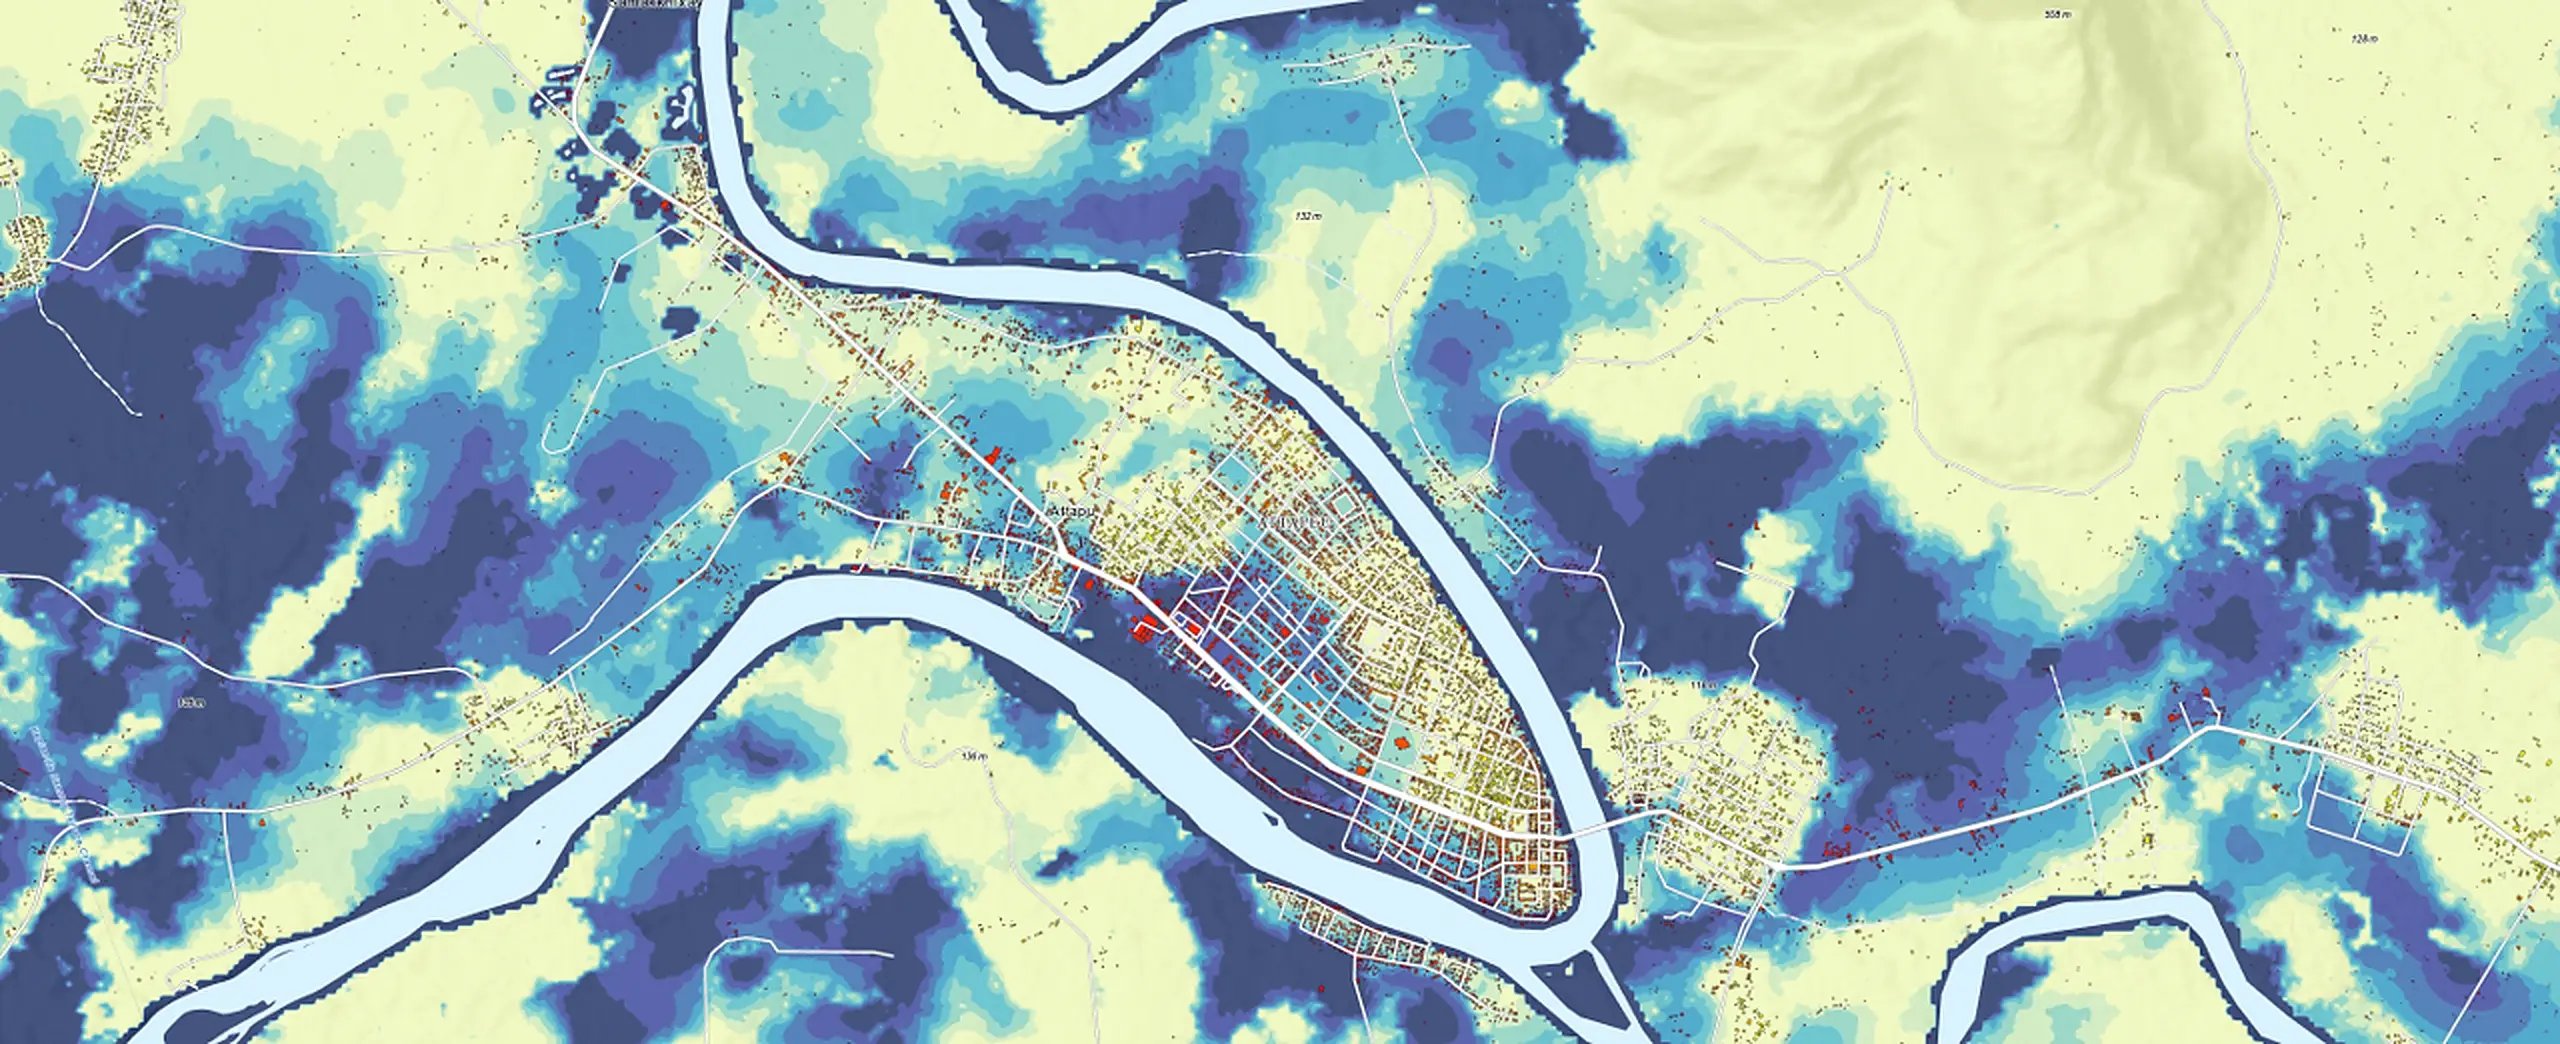
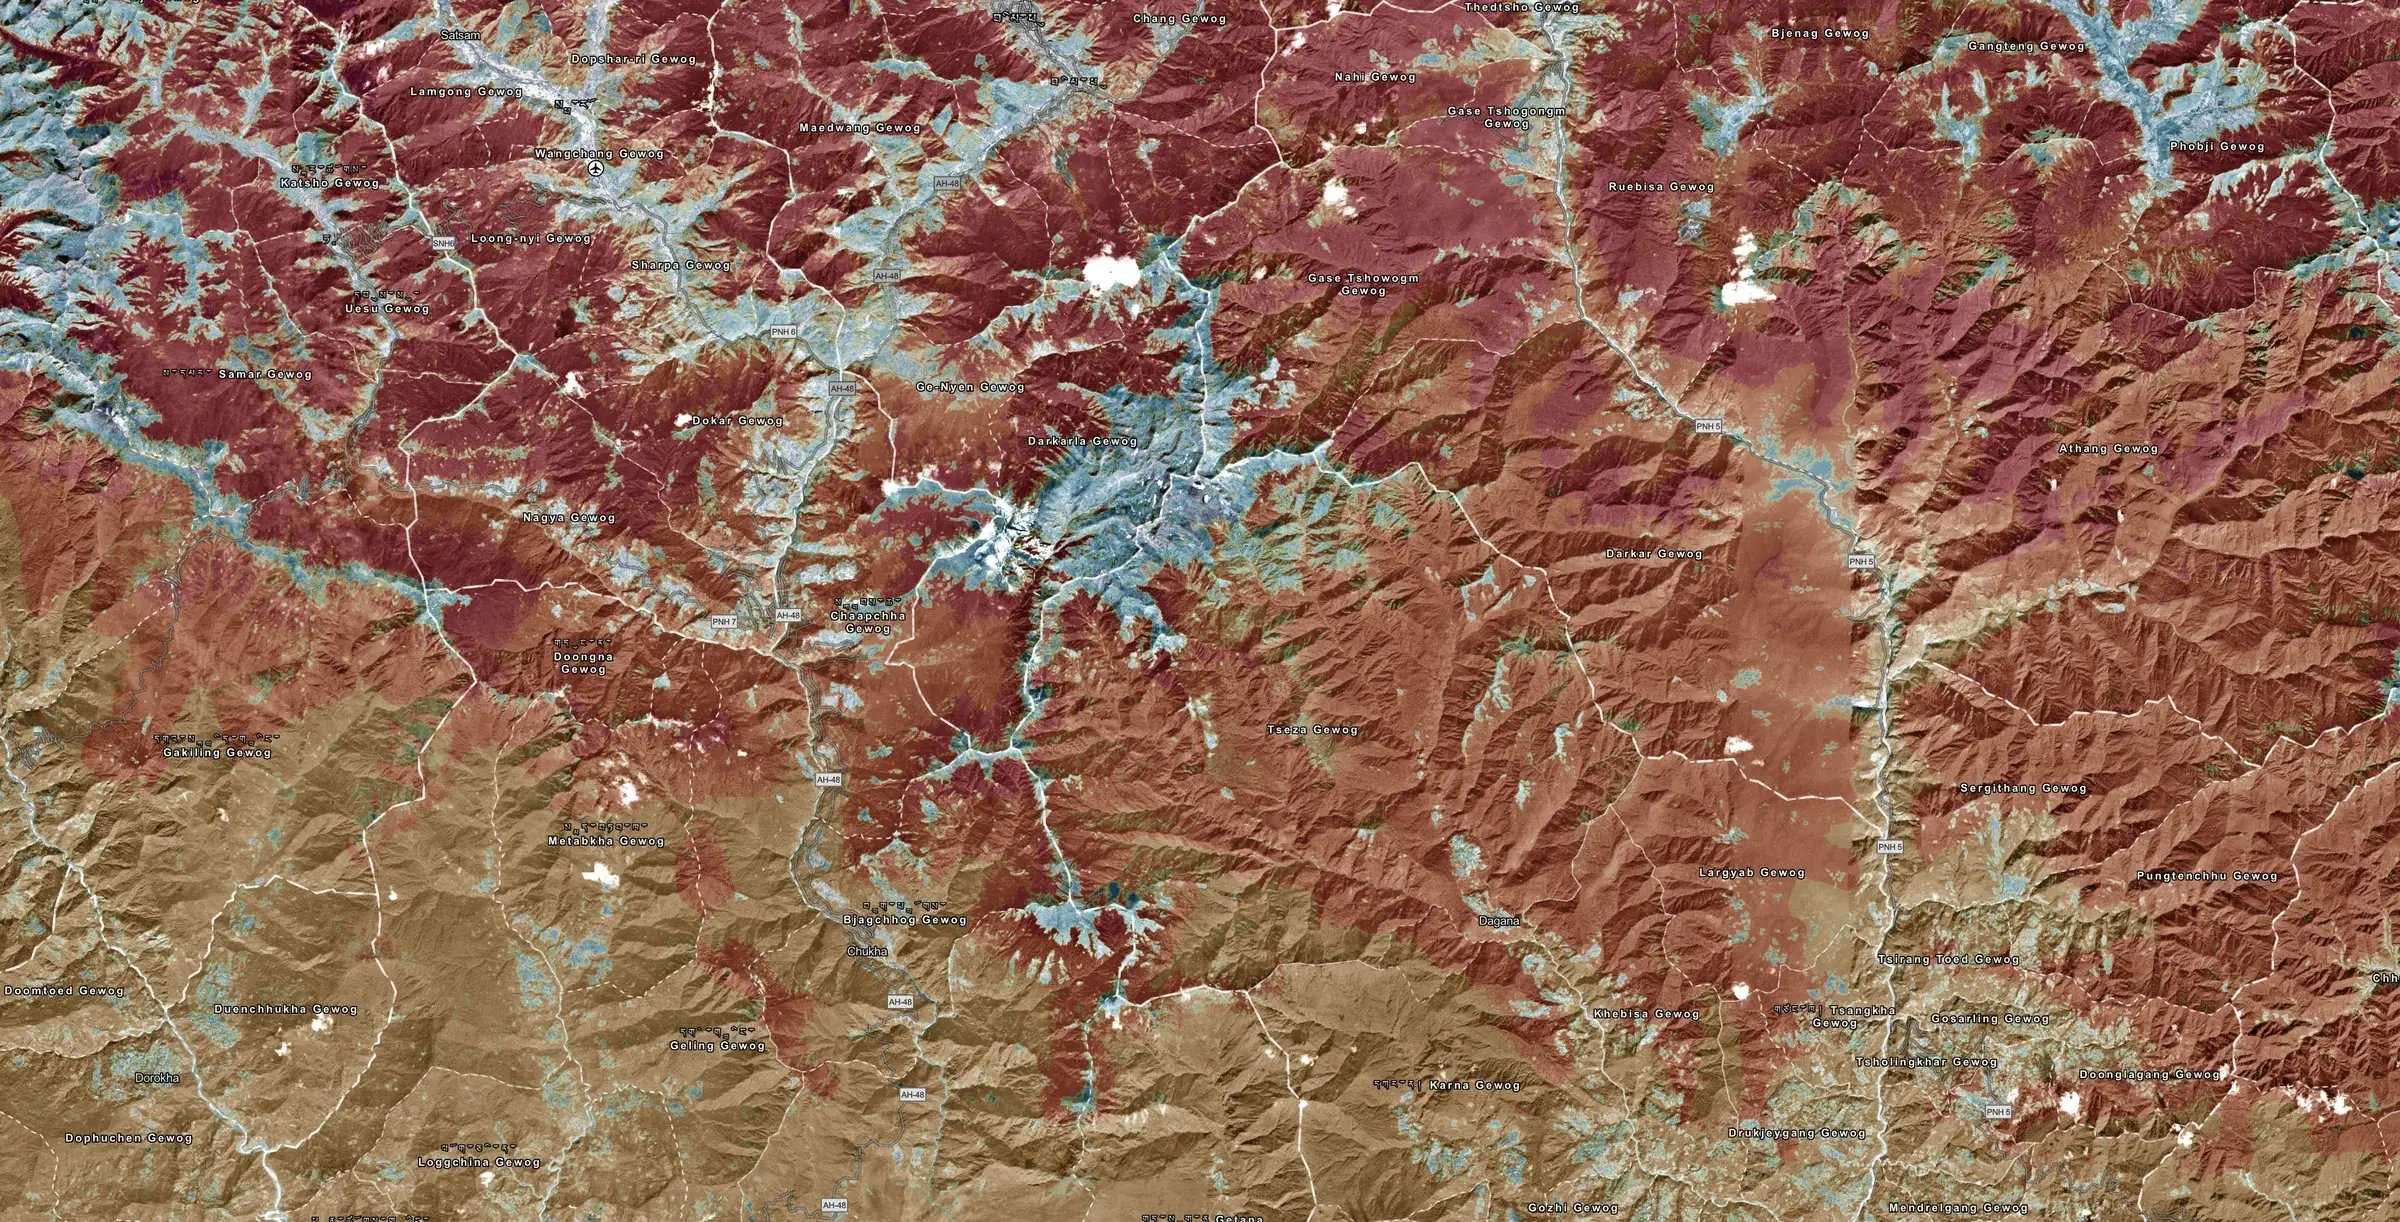
Working with Terranum, the project also developed a landslide inventory and susceptibility analysis for rockfall, debris flow, large torrents and flooding. Susceptibility classes were combined with the replacement value present in each grid cell to produce value-weighted screening layers for each hazard process and study area.
The resulting technical report, GIS layers and web maps gave government stakeholders a common spatial basis for reviewing infrastructure and hazard information.
Key findings
- Approximately 400 km² were analysed across two priority study areas.
- 8,776 buildings were mapped across the two areas.
- The imagery-based building analysis identified substantially more buildings than the supplied government datasets.
- Infrastructure location and replacement-value information were organised into a consistent 30 × 30 m grid.
- Four value-weighted susceptibility layers were produced for each study area: rockfall, debris flow, large torrents and flooding.
- The outputs highlighted grid cells where higher susceptibility classes coincided with greater concentrations of infrastructure value.
Decision value
The outputs provide a regional screening tool for identifying locations that warrant closer field investigation, site-specific hazard analysis or infrastructure review.
They can support discussions about:
- where more detailed geological or engineering assessment is justified;
- where infrastructure monitoring and maintenance may deserve attention;
- where mitigation options should be examined;
- how infrastructure and hazard information can be communicated consistently; and
- where future planning and investment analysis should begin.
Interpretation boundary
These outputs are regional susceptibility and value-weighted screening indicators. Susceptibility does not express the probability of a future event, and mapped exposure does not by itself measure physical vulnerability or risk.
Replacement value was used as a prioritisation weight, not as an estimate of expected damage or loss. Results depend on the source imagery, available infrastructure data, terrain resolution, susceptibility assumptions and replacement-value estimates. Locations identified by the analysis should therefore be verified through appropriate site-specific investigation.
Acknowledgements
This pilot was delivered by Geoneon in partnership with Terranum through the Asian Disaster Preparedness Center’s Climate Innovation Challenge.
Bhutan’s Department of Disaster Management was the principal government beneficiary and collaborator, while the Department of Roads contributed during early project scoping. The Challenge was supported through the Program for Asia Resilience to Climate Change, funded by the UK Foreign, Commonwealth & Development Office and administered by the World Bank.
Have a project or question in mind?