Skip to content
Hero-Heat-4

Smarter Heat Intelligence. From Hotspots to Resilient Cities.

Geoneon Heat maps urban heat hotspots, measures exposure of people and infrastructure, and highlights where greening delivers the greatest cooling benefit.
PRODUCT OVERVIEW

What is Geoneon Heat?

Geoneon Heat identifies urban heat hotspots, measures exposure of people and infrastructure, and pinpoints where greening delivers the greatest cooling benefit.

Built for councils, governments, and planners, it transforms complex environmental and demographic data into clear, actionable insights — underpinned by a set of geospatial indices — helping cities design healthier, safer, and more climate-resilient communities.

ACTIONABLE INSIGHTS

What Can You Do with Geoneon Heat?

Geoneon Heat helps governments and planners move from identifying heat hotspots to implementing targeted, evidence-based cooling strategies.

HEAT SUSCEPTIBILITY INDEX

Where are the hottest places?

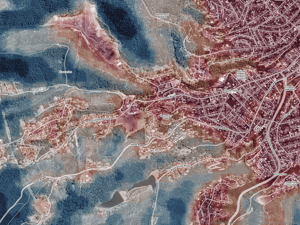
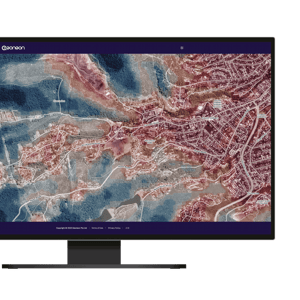
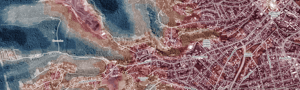
Maps land surface temperature hotspots across cities, helping planners identify priority areas for cooling and adaptation measures.

Heat-Mockup-2a
RESIDENTIAL HEAT RISK INDEX

Which communities face the greatest risk?

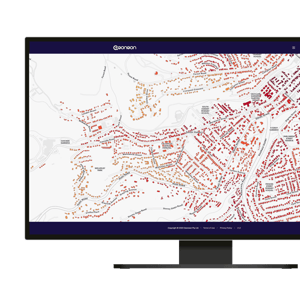
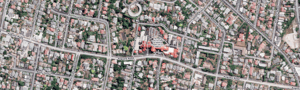
Combines building-level heat exposure with social vulnerability to pinpoint neighbourhoods where residents are most at risk during extreme heat events.

Heat-Mockup-5a
GREENING PRIORITISATION

Where should we green first?

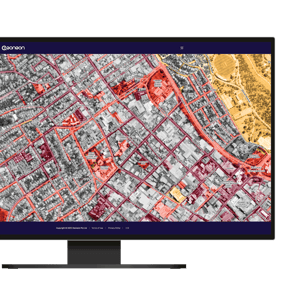
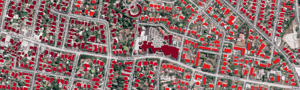
Pinpoints canopy deficit areas where planting trees or adding shade delivers the greatest cooling benefit, ensuring investments achieve maximum impact.

Heat-Mockup-6a
SEE THE DIFFERENCE

From Heat Maps to Cooling Strategies

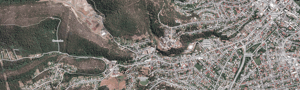
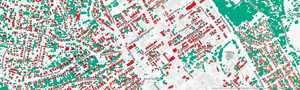
Visual comparisons show how Geoneon Heat turns raw environmental data into actionable insights. With simple before/after views or scrollable overlays, complex indices become clear strategies for resilience and planning.


Heat Susceptibility

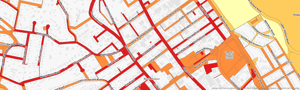
See how everyday urban form translates into measurable heat hotspots, with the Heat Susceptibility Index highlighting areas most prone to extreme surface temperatures.

Comparison-Susceptibility-A-1a
Urban Context
Comparison-Susceptibility-B-1a
Heat Susceptibility Index

Residential Heat Risk

The Residential Heat Risk Index combines exposure and vulnerability to reveal where residents face the highest danger during heat events.

Comparison-Risk-A-1a
Urban Context
Comparison-Risk-B-1a
Residential Heat Risk Index

Greening Prioritisation

Residential heat risk with existing canopy coverage help to identify priority zones for tree planting or shading — showing where greening delivers the greatest cooling benefit.

Comparison-Priority-A-1a
Residential Risk & Canopy
Comparison-Priority-B-1a
Greening Prioritisation

PIA-Award-1

National Award for Planning Excellence

Geoneon, with UTAS, City of Launceston, and WSP, won the 2025 National Award for Planning Research Excellence from the Planning Institute of Australia for the Urban Greening Strategy — recognised for innovation, collaboration, and tackling heat resilience through urban trees and remote sensing.

BUILT ON EVIDENCE, DELIVERED WITH EASE

From Science to Scalable Solutions

Geoneon Heat is grounded in peer-reviewed methods from the scientific literature, adapted into proprietary algorithms to ensure scalability, efficiency, and consistency across regions. Our indices are derived from validated earth observation and demographic datasets, tested alongside councils and agencies, and aligned with observed heat events and planning frameworks.

Results are delivered in formats that fit your workflow making it simple to move from analysis to action:

  • GeoTIFF / Shapefiles
  • Webservices (WMS/WFS)
  • Webmaps
Hero-Heat-4

Ready to Map Urban Heat and Build Resilience?

Whether you are targeting a single neighbourhood or planning for an entire city, Geoneon Heat delivers actionable indices and insights to guide cooling, adaptation, and healthier community design.