Skip to content
Hero-Wildfire-1

Predictive wildfire mapping for long-term preparedness and planning

AI-powered severity and exposure layers to support land-use planning, infrastructure protection, and climate resilience.
PRODUCT OVERVIEW

What is Geoneon Wildfire?

Geoneon Wildfire provides AI-driven geospatial layers that estimate wildfire severity — how intense a fire would be if it occurred — and building exposure — how much a built asset could be affected if surrounding vegetation burns.

Built for government, insurance, and infrastructure, it supports climate adaptation, planning assessments, and asset prioritisation across large regions.

ACTIONABLE INSIGHTS

What Can You Do with Geoneon Wildfire?

Geoneon Wildfire helps you understand where fires are likely to burn most severely — and who or what is most exposed if they do. It goes beyond static hazard maps. Our dynamic, AI-driven model adapts to real-world change, allowing you to detect, measure, and act on evolving wildfire severity and exposure.

FUEL REDUCTION & CHANGE DETECTION

Spot treatment areas and monitor regrowth

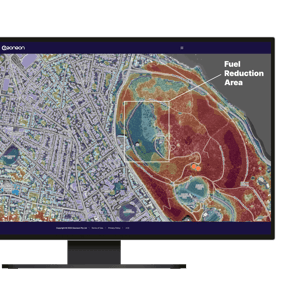
Identify where prescribed burns or fuel reduction works have occurred, confirm treatment coverage, and measure regrowth over time. Supports evidence-based fire management and planning.

Wildfire-Mockup-4a
LAND-USE CHANGE TRACKING

See how exposure shifts as landscapes change

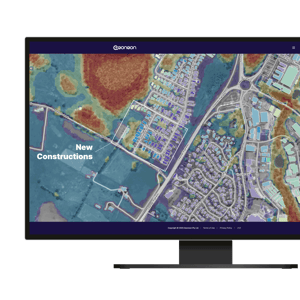
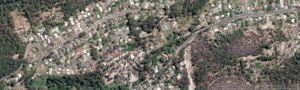
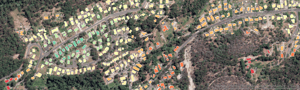
Detect new housing developments, land clearing, or major vegetation changes, and update severity and exposure layers to reflect the new conditions.

Wildfire-Mockup-6a
COMMUNITY & ASSET EXPOSURE METRICS

Quantify who and what is most exposed

Aggregate exposure scores for suburbs, LGAs, or other administrative areas to highlight high-vulnerability zones. Ideal for councils, insurers, and emergency managers to prioritise investment and mitigation.

Wildfire-Mockup-5a
SEE SEVERITY AND EXPOSURE IN ACTION

Visualise the Difference

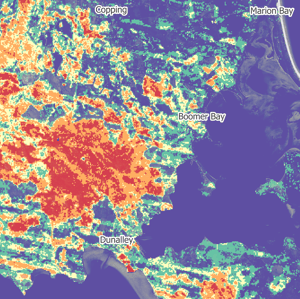
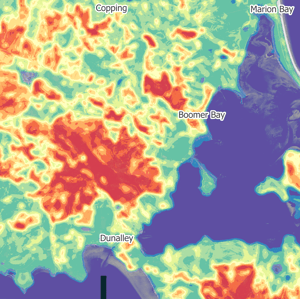
Geoneon Wildfire turns complex data into clear, decision-ready maps. Explore interactive sliders to see how severity and exposure change with the landscape.


Severity Mapping

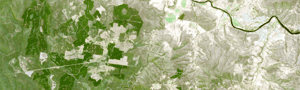
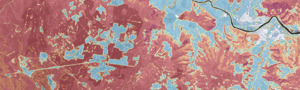
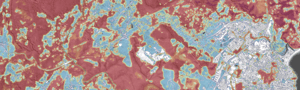
From vegetation structure, climate data, and topography, the Wildfire Severity Index predicts how intense a fire could burn in any location.

Comparison-1a
Landscape Context
Comparison-1b
Wildfire Severity Index

Exposure Mapping

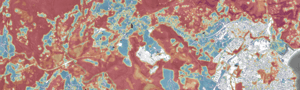
Overlay severity with building footprints to see which assets are most exposed if surrounding vegetation burns.

Comparison-7a
Built Environment Context
Comparison-7b
Wildfire Exposure Index

Change Over Time

Track the impact of prescribed burns, vegetation clearing, or new developments, and instantly see how severity and exposure shift.

Comparison-4a
2024
Comparison-4b
2025
FROM INPUTS TO INSIGHT

How It Works

Geoneon Wildfire combines advanced Earth observation data with AI modelling to deliver accurate, scalable wildfire severity and exposure layers — ready for immediate use in planning, mitigation, and resilience strategies.

1
Earth Observation

Global satellite data

Satellite-derived vegetation, topography, and climate data form the foundation. No LiDAR or costly custom surveys are required, enabling coverage at regional to national scale.

2
AI Models

Trained on LiDAR-validated datasets

Our deep learning models are trained on billions of pixels of satellite and LiDAR data, enabling accurate height and cover estimation even where ground truth is limited.

3
Plug-and-Play Delivery

Data in your hands — any way you need it

We deliver outputs in standard geospatial formats, ready to integrate into your workflows: GeoTIFF/ Shapefile, Web services (WMS/WFS), Webmaps.

THE GEONEON WILDFIRE DATA STACK

More Than a Model

Unlike traditional fire spread simulations, Geoneon Wildfire uses a layered predictive approach — the Geoneon Wildfire Data Stack — stacking key spatial predictors to deliver a consistent, scalable view of wildfire severity and exposure anywhere in the world.

Geoneon-Wildfire-Data-Stack-2

Core data layers include:

  • Vegetation structure — height, cover, and type from Geoneon Vegetation
  • Topography — slope, elevation, and dissection
  • Climate context — rainfall, moisture, and projections
  • Built environment — building footprints, and proximity to flammable vegetation
  • Administrative boundaries & land use — for aggregation and reporting
BUILT ON EVIDENCE

Proven Accuracy

Designed to reflect real-world fire behaviour, the Geoneon Wildfire model is calibrated and tested against actual fire events. Compared with known fire events to verify predictive patterns and calibrated using event data to fine-tune severity and exposure outputs.

Dunalley-Severity-dNBR
01delta Normalized Burn Ratio (dNBR)
Dunalley-Severity-Gn
02Geoneon Wildfire Severity Index
Dunalley-Graph-1
03Prediction Evaluation
Hero-Wildfire-1

Ready to Map Wildfire Severity and Exposure?

Whether you need coverage for a single community or an entire region, Geoneon Wildfire delivers actionable severity and exposure insights you can trust.