Smarter Vegetation Intelligence. From Space to Street Trees.
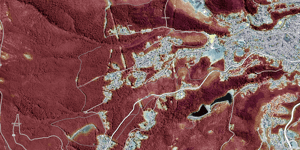
Predictive wildfire mapping for long-term preparedness and planning
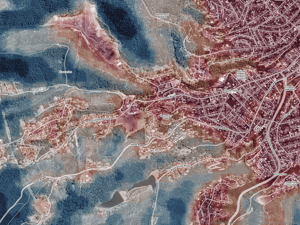
Smarter Heat Intelligence. From Hotspots to Resilient Cities.
All our product briefs and reports in one place. Explore and download the resources you need to understand and apply Geoneon’s climate risk solutions.