

Industry
Emergency Management
Challenge
Local governments needed consistent spatial evidence to understand where buildings and communities were more exposed to bushfire and where preparedness and mitigation warranted greater attention.
Results
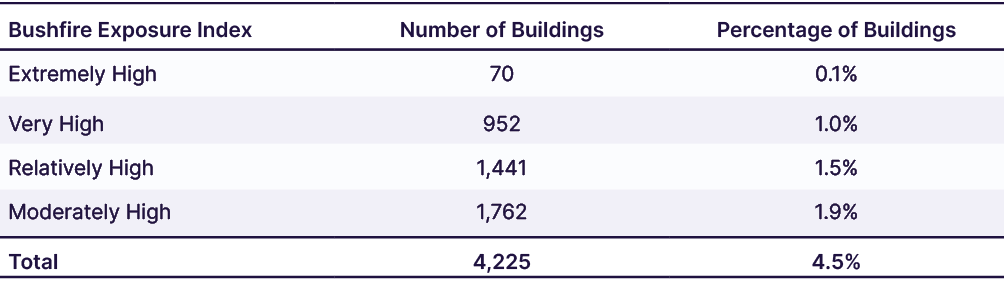
More than 94,000 buildings across 132 Greater Hobart suburbs assessed, with 4,225 buildings — 4.5% — classified from Moderately High to Extremely High bushfire exposure in the 2024 assessment.
Key Product
Geoneon Wildfire
About
Geoneon’s Anticipate and Monitor the Impact of Bushfires in Greater Hobart project commenced in 2022 as part of the Australian Government’s Preparing Australian Communities – Local Stream, funded by the National Emergency Management Agency (NEMA).
The project initially worked with Glenorchy City Council, the City of Hobart and Kingborough Council, with the 2024 assessment expanding across Brighton, Clarence and Sorell, providing a broader picture of bushfire exposure across Greater Hobart.
Geoneon developed repeatable bushfire severity and building-exposure analysis, supported by high-resolution geospatial data and public-facing reporting, to help local governments and communities understand where exposure is concentrated and support long-term preparedness.
The Challenge
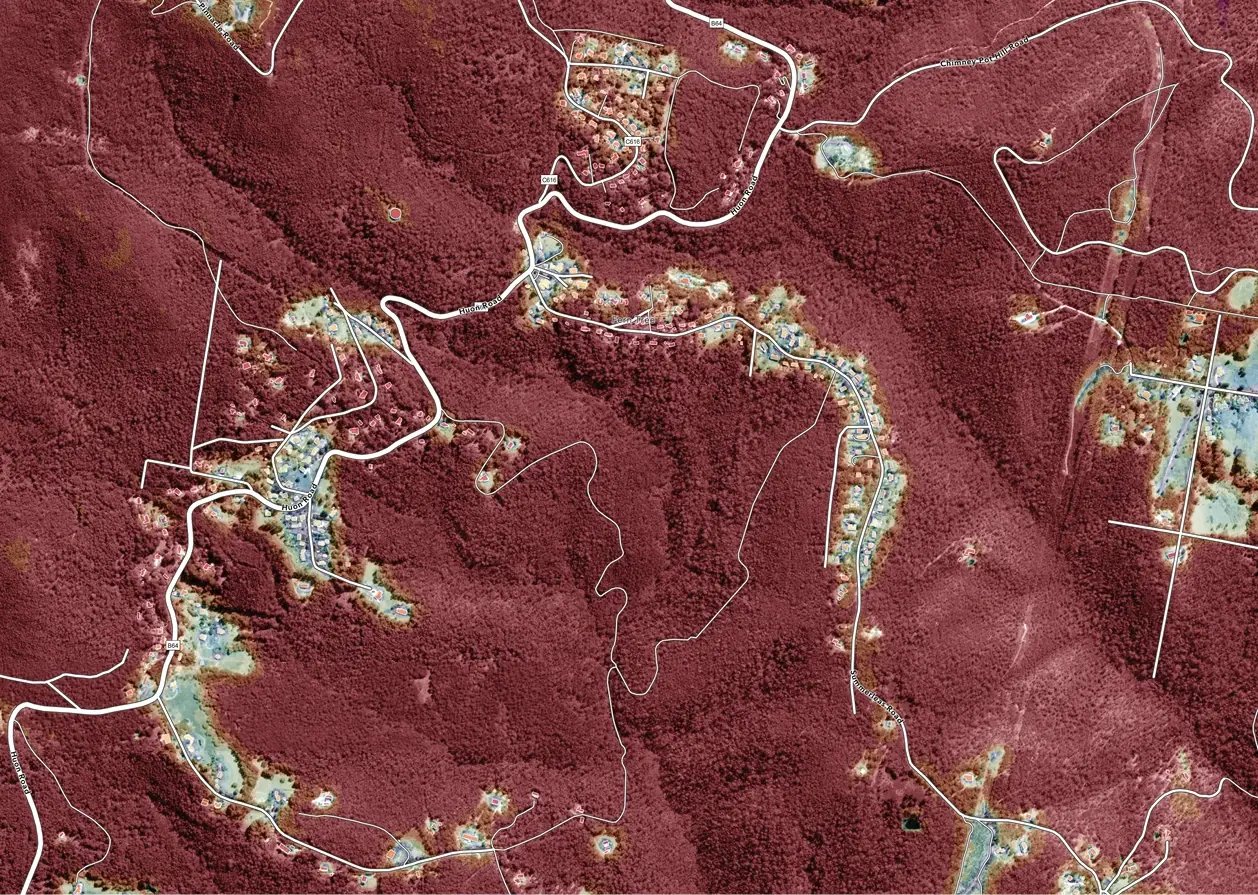
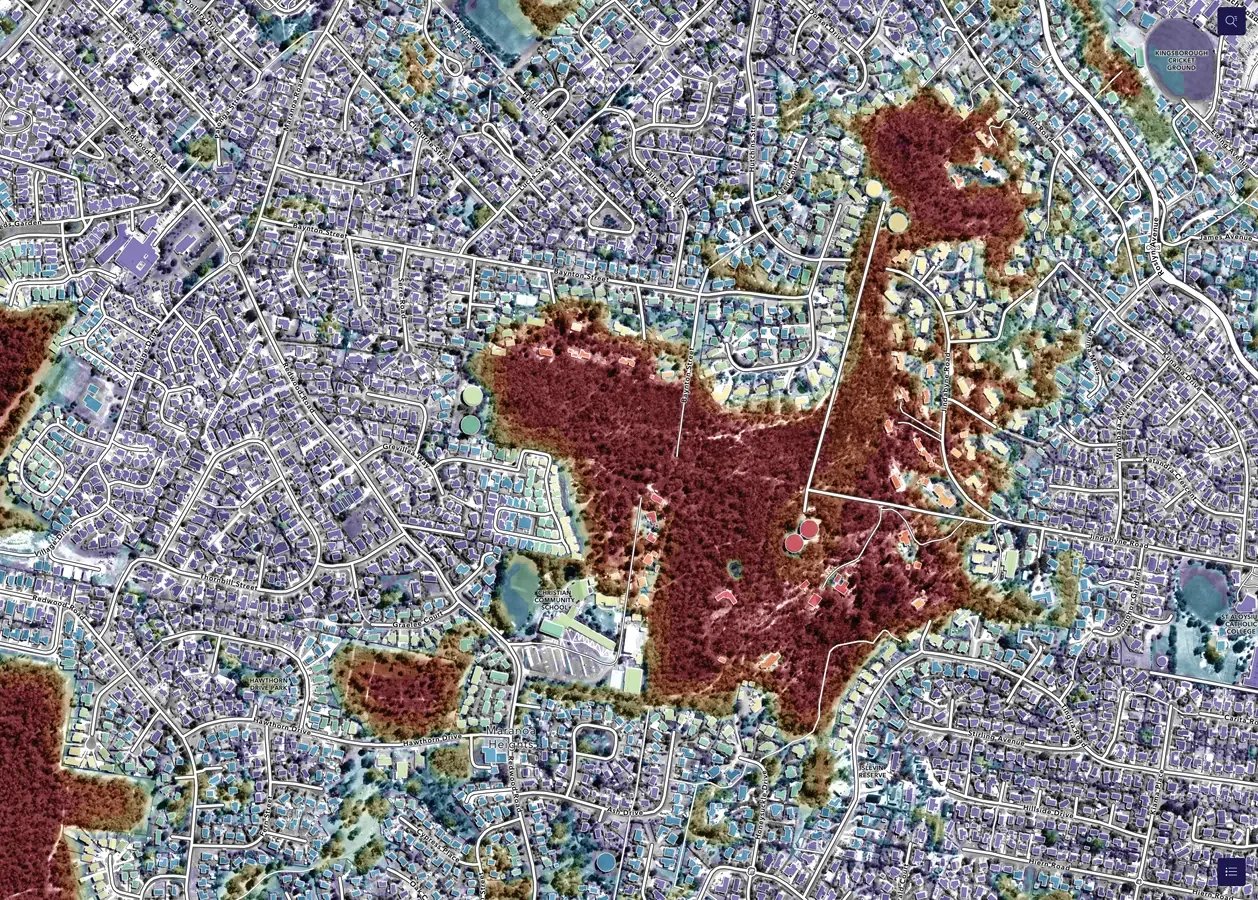
Bushfire exposure varies considerably across Greater Hobart as vegetation, terrain and development interact at the urban–bushland interface.
Local governments needed consistent spatial evidence to understand:
- where landscape conditions could contribute to more severe bushfire behaviour;
- which buildings and communities had greater exposure;
- how exposure varied between councils and suburbs; and
- where preparedness, mitigation or more detailed investigation should be prioritised.
The project also needed a repeatable approach that could be updated as new imagery, building information and environmental data became available.
What Geoneon did
Geoneon developed a repeatable spatial framework combining high-resolution satellite imagery, vegetation and fuel information, terrain, climate information, mapped building footprints and spatial modelling.
The analysis produced two complementary layers:
- Wildfire Severity — describing how potential fire severity varies across the landscape based on factors including vegetation, terrain and climate.
- Building Exposure — linking mapped buildings with surrounding bushfire conditions to identify where exposure is comparatively higher.
The project produced successive Greater Hobart Bushfire Exposure Index assessments, supported by reports and a public web platform, enabling local governments and communities to explore spatial patterns of bushfire exposure. The first 2022–23 assessment focused on Glenorchy, Hobart and Kingborough; the 2024 assessment expanded across six Greater Hobart council areas.
The Results
The 2024 Greater Hobart Bushfire Exposure Index assessed more than 94,000 buildings across 132 suburbs.
Key findings included:
- 4,225 buildings (4.5%) classified from Moderately High to Extremely High bushfire exposure;
- 1,727 buildings in Kingborough in these higher-exposure categories;
- 1,205 buildings in Hobart and 751 in Clarence in the same categories; and
- suburb-level analysis identifying locations where both the number and proportion of exposed buildings were comparatively high.
The assessment provided a consistent evidence base for comparing bushfire exposure across councils and suburbs and identifying locations that warranted closer attention.
Decision value
The analysis supports local governments and communities to:
- identify areas with comparatively higher bushfire exposure;
- prioritise preparedness and mitigation;
- target more detailed investigation where warranted;
- support resource-allocation and planning discussions; and
- communicate bushfire exposure more consistently with communities.
Because the framework is repeatable, assessments can also be updated as new imagery, building information and environmental data become available.
Interpretation boundary
The index describes relative wildfire severity and building exposure based on mapped landscape conditions. It does not predict whether or when a fire will ignite, model live fire spread, or predict the outcome for an individual building.
Acknowledgement
This project was funded by the National Emergency Management Agency through the Preparing Australian Communities – Local Stream. The project initially worked with Glenorchy City Council, the City of Hobart and Kingborough Council, with the 2024 assessment expanding across Brighton, Clarence and Sorell.
Have a project or question in mind?