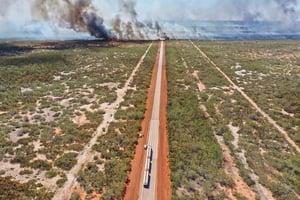
Wildfire Severity and Vulnerability Model
The Shire of Dundas, with the support of National Disaster Risk Reduction Grant Program, and in association with the Freight and Logistics Council of Western Australia engaged Geoneon to undertake a proof-of-concept project combining earth observation data, machine learning, and advanced analytics to:
- Conduct vegetation analysis and infrastructure identification.
- Analyse exposure and vulnerability of infrastructure and supply chains to wildfire.

About the Shire of Dundas
The Shire of Dundas is a local government area in the Goldfields-Esperance region of Western Australia. The Shire covers a very large area, approximately 1.5 times the size of Tasmania, and is intersected by major supply chain routes for freight, telecommunications, water, gas, and critical natural resources.
Norseman, the seat of government, is a major stopping point within the Great Western Woodlands for freight and travellers to and from the Eastern States.
Industry: Government
Area Size: 100 km2
Location: Australia
Solution:
-
Wildfire
Project Description
Through December 2019 and January 2020, the Shire of Dundas was significantly impacted by wildfires burning across about 550,000 hectares of land. Approximatively 330 kilometres of the Eyre Highway were closed for twelve days.
After this catastrophic event, the State Emergency Management Committee of Western Australia commissioned a review, which highlighted the vulnerability of the Eyre Highway and other critical inter-state roads. Freight and supply chains were particularly impacted with an estimated cost for the transport industry of $10 million per day, every day the highway was closed. As a result, the Shire of Dundas, in association with the Shire of Coolgardie and the City of Kalgoorlie-Boulder, are preparing a bushfire risk management plan for each council to be completed by May 2023.

The Shire of Dundas, in Western Australia, was affected by wildfires that burned about 550,000 hectares of land and closed 330 kilometres of the Eyre Highway for 12 days. The emergency management committee subsequently commissioned a review, which revealed the vulnerability of the highway and other critical inter-state roads, and the resulting impact on freight and supply chains was estimated to cost the transport industry $10 million per day.
For this project, Geoneon’s activities were to:
- Develop a suitable fuel model and wildfire severity hazard map.
- Identify infrastructure.
- Analyse exposure and vulnerability of infrastructure and supply chains to wildfire.
Wildfire severity is defined as the amount of fire induced change to physical ecosystem components such as vegetation and soil, or the amount of fuel present and the effect it would have on the surrounding environment if it was burnt in a wildfire.
There are several key criteria that can influence the severity of a wildfire. These include the availability of fuels like grass, brush, and trees, the topography of the area, weather conditions, climate, and the presence of human infrastructure, such as houses, roads, and power lines. Semi-arid environments have particularly complex fuel arrangements. The amount of time that has passed since the last wildfire in an area can also impact the severity of a new wildfire, as a build-up of fuels can lead to more intense fires.
For this project Geoneon used high resolution (50 cm), multispectral (8-band) satellite imagery to calculate vegetation cover. The vegetation cover was segmented into vegetation classes, which was then used to produce a fuel density map. Geoneon used then a 1-arcsecond (~30-metre) Digital Elevation Model from Geoscience Australia’s Elevation Information System (ELVIS) to characterise the slope. Fuel density and slope were then combined to calculate the final wildfire severity map.

Example of tree mapping result along the main transport infrastructure (left) and zoom-in (right).

Very-high-resolution multi-band satellite imagery (left) used to compute the wildfire fuel model (right).

Very-high-resolution multi-band satellite imagery (left) used to compute the wildfire severity model (right) at a telecommunication relay southeast of Norseman.
Geoneon then integrated indicators and footprints of the infrastructure to produce a 10-by-10 metre spatial grid which contains the total indicator value of assets in each grid cell. In consultation with the Shire of Dundas, Geoneon included financial replacement value of infrastructure and freight values.
Geoneon calculated the financial vulnerability in each grid cell as the wildfire severity weight multiplied by the asset replacement value. This financial vulnerability is a function of the level of wildfire severity and the replacement value of the infrastructure. Each level of wildfire severity has a weighting that was applied to the infrastructure value of the affected infrastructure. The units of vulnerability are therefore a single weighted replacement cost of infrastructure per cell. This presents a simple metric for easy spatial interpretation of the financial vulnerability of an area of infrastructure.
Freight related vulnerabilities were calculated in a similar manner. The metrics used in the freight vulnerabilities were attached to the relevant roads and rail lines on the map. These metrics are then multiplied by the relevant severity vulnerability factor which results in a weighted freight impact metric.

Satellite imagery of Norseman (left) and the same satellite imagery with the 10mx10m infrastructure model overlayed (right)

Fire severity model (right), financial vulnerability model (centre), and freight vulnerability model (right)